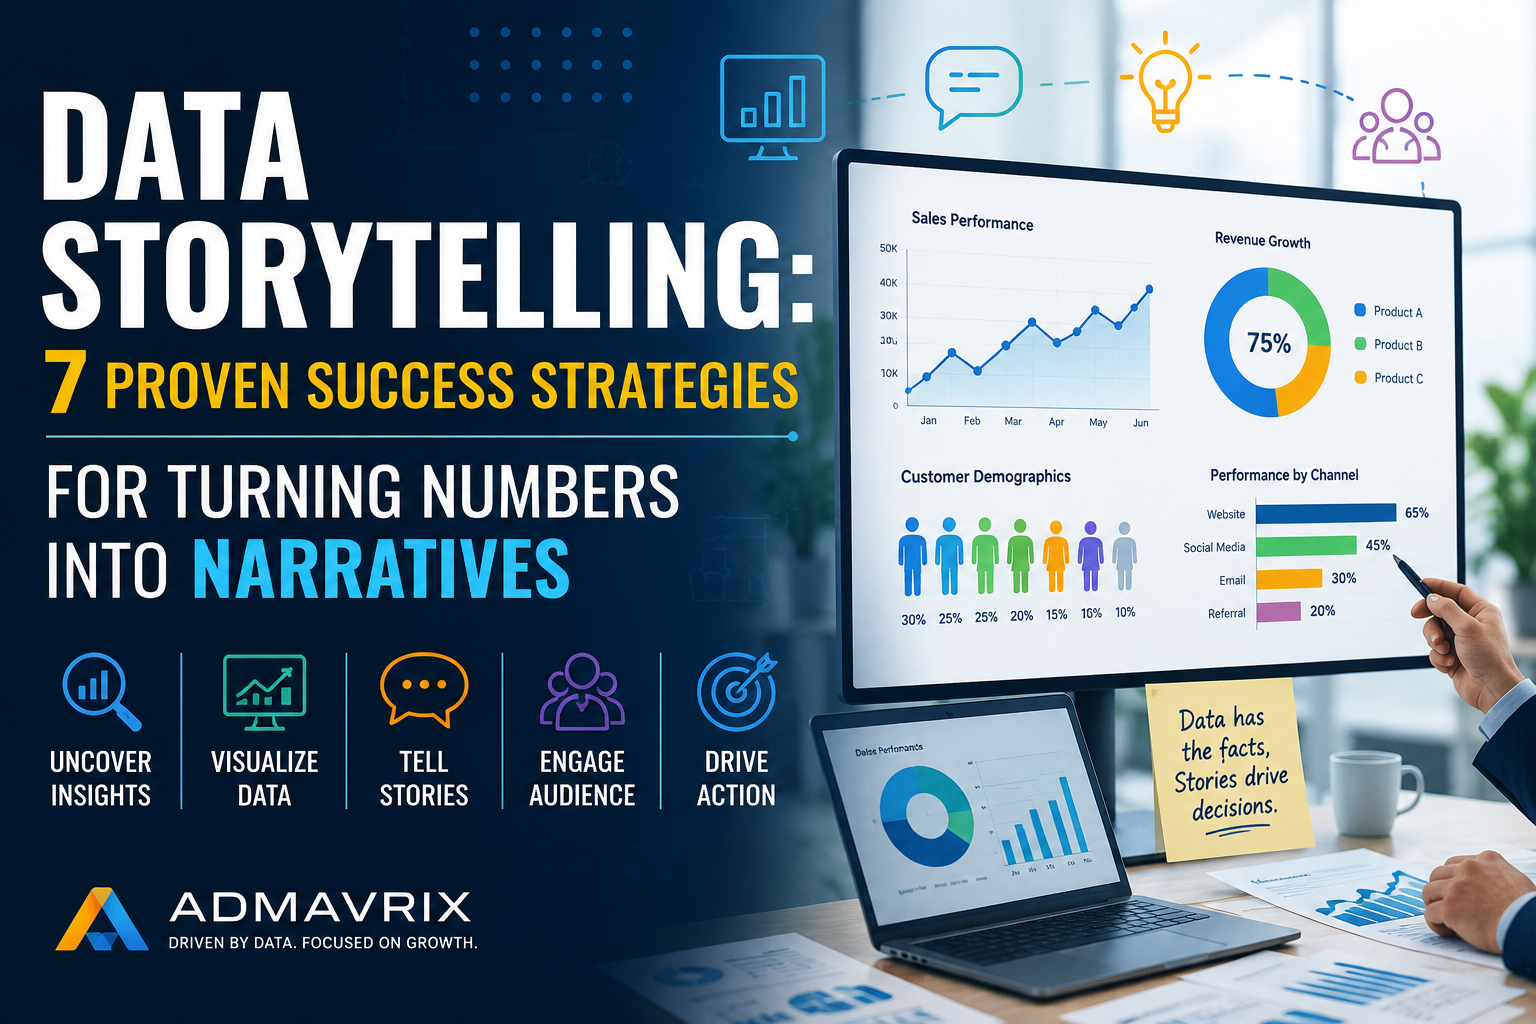
Data alone rarely inspires action. Stories do. The ability to transform raw numbers into compelling narratives is becoming one of the most valuable skills in modern marketing and business intelligence. Effective data storytelling helps organizations communicate insights clearly, influence decisions, and drive measurable success.
Introduction
Businesses generate enormous volumes of data every day. However, numbers and spreadsheets alone often fail to communicate meaningful insights. That’s where data storytelling comes in.
Data storytelling combines analytics, visualization, and narrative techniques to transform complex datasets into engaging stories that audiences can understand and act upon. From marketing reports to executive presentations, turning numbers into narratives helps organizations unlock the true value of their data.
What Is Data Storytelling?
Data storytelling is the process of using data, visuals, and narratives to communicate insights effectively. It combines:
- Data analysis
- Visualization
- Storytelling techniques
The goal is not simply to show numbers but to explain what they mean and why they matter.
Data Storytelling: 7 Proven Success Strategies for Turning Numbers Into Narratives
1. Start with a Clear Objective
Before presenting data, define the purpose of your story. Identify the key message you want your audience to understand and ensure every insight supports that objective.
2. Understand Your Audience
Tailor your narrative to the needs and knowledge level of your audience. Executives may prefer high-level insights, while analysts often require detailed metrics and explanations.
3. Use Visualizations to Simplify Complex Data
Charts, graphs, dashboards, and infographics make information easier to understand and help audiences quickly identify trends, patterns, and opportunities.
4. Add Context to Every Metric
Numbers alone do not tell a story. Explain what the data means, why it matters, and how it impacts business goals to create meaningful insights.
5. Build a Narrative Around Insights
Structure your data story with a beginning, middle, and end. Highlight what happened, why it happened, and what actions should be taken next.
6. Focus on Actionable Recommendations
Great data storytelling goes beyond reporting statistics. Provide practical recommendations that help stakeholders make informed decisions and drive measurable results.
7. Continuously Optimize with New Data
Data storytelling is an ongoing process. Regularly update your insights, refine visualizations, and incorporate new information to keep narratives accurate and relevant.
Key Points
1. Data Provides Evidence
Numbers support decision-making with facts.
2. Stories Create Emotional Connections
Narratives make insights memorable.
3. Visuals Improve Understanding
Charts and graphs simplify complex information.
4. Context Adds Meaning
Explaining why metrics matter improves interpretation.
5. Actionable Insights Drive Results
Stories should lead to decisions and actions.
Features of Data Storytelling
Data-Driven Narratives
Transform numbers into meaningful messages.
Interactive Visualizations
Improve audience engagement.
Better Communication
Simplify complex metrics.
Contextual Insights
Explain trends and patterns.
Decision Support
Help stakeholders make informed choices.
Benefits of Data Storytelling
- Improves understanding of analytics.
- Enhances business communication.
- Drives better decision-making.
- Makes presentations engaging.
- Increases stakeholder confidence.
- Simplifies complex reports.
- Supports marketing performance analysis.
Quick Insights Table
| Factor | Traditional Reports | Data Storytelling |
|---|---|---|
| Engagement | Low | High |
| Understanding | Moderate | Excellent |
| Decision Making | Slower | Faster |
| Visualization | Limited | Strong |
| Audience Retention | Low | High |
| Impact | Moderate | Significant |
Small Case Study
A SaaS company noticed declining conversions. Instead of presenting spreadsheets, the marketing team created a story-driven dashboard showing where users dropped off.
Result:
- 28% improvement in conversions
- Better executive understanding
- Faster optimization decisions
Why Data Storytelling Matters
Modern businesses rely heavily on analytics. However, numbers without context often confuse audiences.
Effective data storytelling answers three questions:
What Happened?
Identify key metrics and trends.
Why Did It Happen?
Explain underlying causes.
What Should We Do Next?
Provide actionable recommendations.
This framework turns information into decisions.
Real Example
Netflix uses viewer data to understand audience behavior. Instead of focusing solely on numbers, the company interprets viewing patterns and creates personalized recommendations.
This narrative-driven approach increases user engagement and customer retention.
Which aspect of data storytelling do you find most challenging?
- Data Visualization
- Story Creation
- Analytics Interpretation
- Presenting Insights
Emerging Trends
AI-Powered Analytics
Artificial intelligence simplifies insight generation.
Interactive Dashboards
Real-time visual reporting improves understanding.
Predictive Storytelling
Businesses are using AI to forecast future trends.
Personalized Reports
Customized narratives increase relevance.
Data Democratization
Analytics are becoming accessible to everyone.
Common Mistakes
Showing Too Many Metrics
Too much information overwhelms audiences.
Ignoring Context
Numbers alone do not explain outcomes.
Using Complex Charts
Simple visuals are easier to understand.
Lack of Story Structure
Insights become confusing without a narrative.
No Actionable Recommendations
Stories should drive decisions.
Pro Tips
✔ Focus on one key message.
✔ Use clear visualizations.
✔ Add context to every metric.
✔ Know your audience.
✔ Present actionable insights.
✔ Use real-world examples.
✔ Avoid unnecessary complexity.
Expert Quotes
“The goal is to turn data into information and information into insight.”
— Carly Fiorina
“Without data, you’re just another person with an opinion.”
— W. Edwards Deming
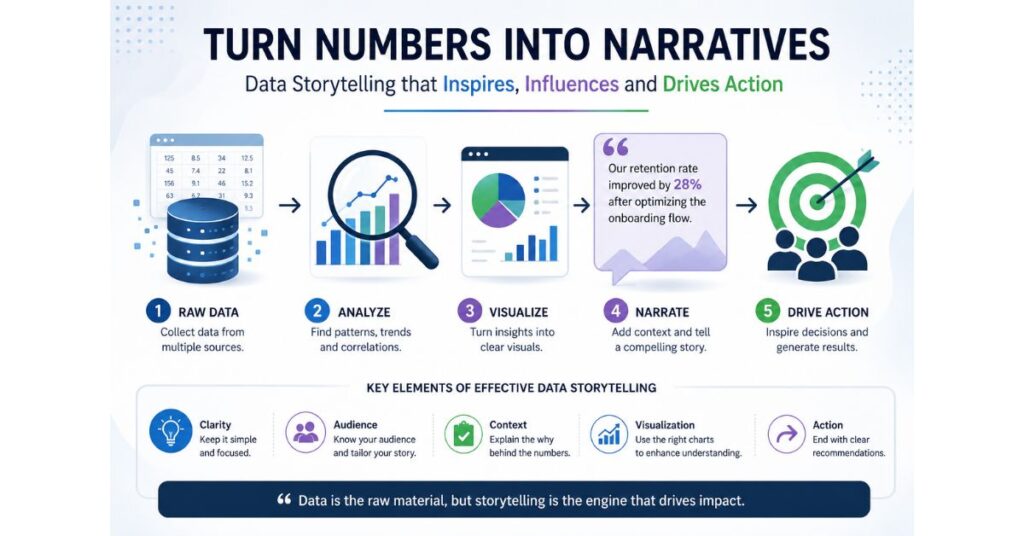
Step-by-Step Guide
Step 1: Collect Data
Gather relevant metrics and KPIs.
Step 2: Analyze Trends
Identify patterns and opportunities.
Step 3: Create Visuals
Use charts and graphs to simplify information.
Step 4: Build the Narrative
Explain what happened and why.
Step 5: Add Context
Show the business impact.
Step 6: Recommend Actions
Provide clear next steps.
Step 7: Present Insights
Communicate findings effectively.
Points Recap
- Data storytelling combines analytics and narratives.
- Visuals improve understanding.
- Context creates meaning.
- Stories increase engagement.
- Actionable insights support decision-making.
- AI is transforming storytelling.
- Effective communication drives business success.
Future Outlook
The future of data storytelling will be driven by AI, predictive analytics, and interactive visualizations. Businesses that master storytelling with data will gain a competitive advantage, improve communication, and make faster decisions.
As organizations become increasingly data-driven, the ability to turn numbers into narratives will become a critical skill for marketers, analysts, and executives.
Conclusion
Data storytelling is far more than presenting charts and numbers. It is the art of transforming information into narratives that inspire action and drive business success.
By combining data analysis, compelling visuals, and meaningful stories, organizations can communicate insights more effectively and make smarter decisions.
Why Choose Admavrix?
At Admavrix, we help brands transform data into actionable insights through advanced analytics, reporting, and digital marketing strategies. Our experts create meaningful narratives that drive growth and measurable results.
Ready to turn your data into growth?
Contact Admavrix today and unlock smarter, data-driven success.
FAQ
What is data storytelling?
Data storytelling is the process of combining data, visuals, and narratives to communicate insights effectively.
Why is data storytelling important?
It improves understanding, engagement, and decision-making.
What are the components of data storytelling?
Data, visualization, and narrative.
Which tools are used for data storytelling?
Power BI, Tableau, Google Analytics, Excel, and Looker Studio.
How does AI improve data storytelling?
AI automates insights, predictive analytics, and visualization creation.